Engineering
OpenSearch Anomaly Detection으로 실시간 이상 탐지 및 알림 설정 가이드
Remy여기어때
2024년 12월 31일
원문에서 보기 ↗안녕하세요!
여기어때 검색플랫폼개발팀의 레미입니다. OpenSearch의 이상탐지 기능이 흥미로워, 이를 직접 테스트해 본 경험을 여러분과 공유하려 합니다.
개요
OpenSearch는 Random Cut Forest (RCF) 알고리즘을 기반으로 시계열 데이터의 이상치를 실시간으로 감지하는 Anomaly Detection 기능을 제공합니다. RCF는 비지도 학습 알고리즘으로, 데이터 패턴을 모델링하여 비정상적인 변화를 감지하고, 이를 알림(Notification) 기능과 연계해 신속히 대응할 수 있습니다.
이 가이드는 OpenSearch 설정, 데이터 이상 탐지, 알림 설정 과정을 단계별로 다룹니다
환경 설정
OpenSearch가 설치되어 있다는 가정하에 진행했습니다. 설치는 docker-compose.yml 파일을 활용해 OpenSearch와 OpenSearch Dashboards를 구성하였습니다.
Docker Compose를 이용한 설치 예제
docker-compose.yml

version: '3'
services:
  opensearch:
    image: opensearchproject/opensearch:2.17.0
    container_name: opensearch
    environment:
      - discovery.type=single-node
      - node.name=opensearch
      - bootstrap.memory_lock=true # along with the memlock settings below, disables swapping
      - "OPENSEARCH_JAVA_OPTS=-Xms512m -Xmx512m" # minimum and maximum Java heap size, recommend setting both to 50% of system RAM
      - OPENSEARCH_INITIAL_ADMIN_PASSWORD=password
      - TZ=Asia/Seoul
      - network.host=0.0.0.0
    ulimits:
      memlock:
        soft: -1
        hard: -1
      nofile:
        soft: 65536 # maximum number of open files for the OpenSearch user, set to at least 65536 on modern systems
        hard: 65536
    volumes:
      - opensearch-data:/usr/share/opensearch/data
      - opensearch-config:/usr/share/opensearch/config
    ports:
      - 9200:9200
      - 9300:9300 # required for Performance Analyzer
    networks:
      - opensearch-net

  opensearch-dashboards:
    image: opensearchproject/opensearch-dashboards:2.17.0
    container_name: opensearch-dashboards
    ports:
      - 5601:5601
    expose:
      - "5601"
    environment:
     OPENSEARCH_HOSTS: '["https://opensearch:9200"]'
     TZ: Asia/Seoul
    networks:
      - opensearch-net
    depends_on:
      - opensearch

volumes:
  opensearch-data:
  opensearch-config:

networks:
  opensearch-net:
데이터 색인 및 업로드
설치가 완료되면 시계열 데이터 이상 탐지를 테스트하기 위해 데이터를 OpenSearch에 색인해야 합니다. 아래 명령어를 참고하여 색인 설정 및 데이터를 업로드합니다.
색인 생성 및 데이터 업로드 명령어 예시
# 색인설정
 curl -XPUT -ku admin:password "https://localhost:9200/purchases" -H 'Content-Type: application/json' -d'
{
  "settings" : {
    "number_of_shards" : 1,
    "number_of_replicas" : 0
  },
  "mappings" : {
    "properties" : {
      "date" : { "type" : "date" },
      "product_id" : { "type" : "keyword" },
      "purchases" : { "type" : "integer" }
    }
  }
}
'
# 색인설정 확인
 curl -XGET https://localhost:9200/purchases?pretty -ku admin:password

# 문서1건 색인
 curl -XPUT -ku admin:password "https://localhost:9200/purchases/_doc/1" -H 'Content-Type: application/json' -d'
{
  "date" : "2024-10-19" ,
  "product_id" : 1,
  "purchases" : 25
}
'
# 1번 색인 확인
curl -XGET https://localhost:9200/purchases/_doc/1?pretty -ku admin:password

# 벌크 색인
curl -XPOST -ku admin:password "https://localhost:9200/_bulk" -H 'Content-Type: application/json' --data-binary @bulk.json
이상 탐지 설정
1. Anomaly Detection 설정
- OpenSearch Dashboards에 접속 후 Anomaly Detection 메뉴로 이동합니다.
- Create Detector 버튼을 선택해 새로운 이상 탐지기를 생성합니다.
- 감지기 설정:
- 탐지명, 데이터 소스, 시계열 필드를 입력합니다.
- Detector Interval: 데이터 주기에 맞춰 설정 (예: 하루 단위는 24시간).
- Custom Result Index: 결과 저장 여부 선택 (성능 저하 방지를 위해 비활성화).
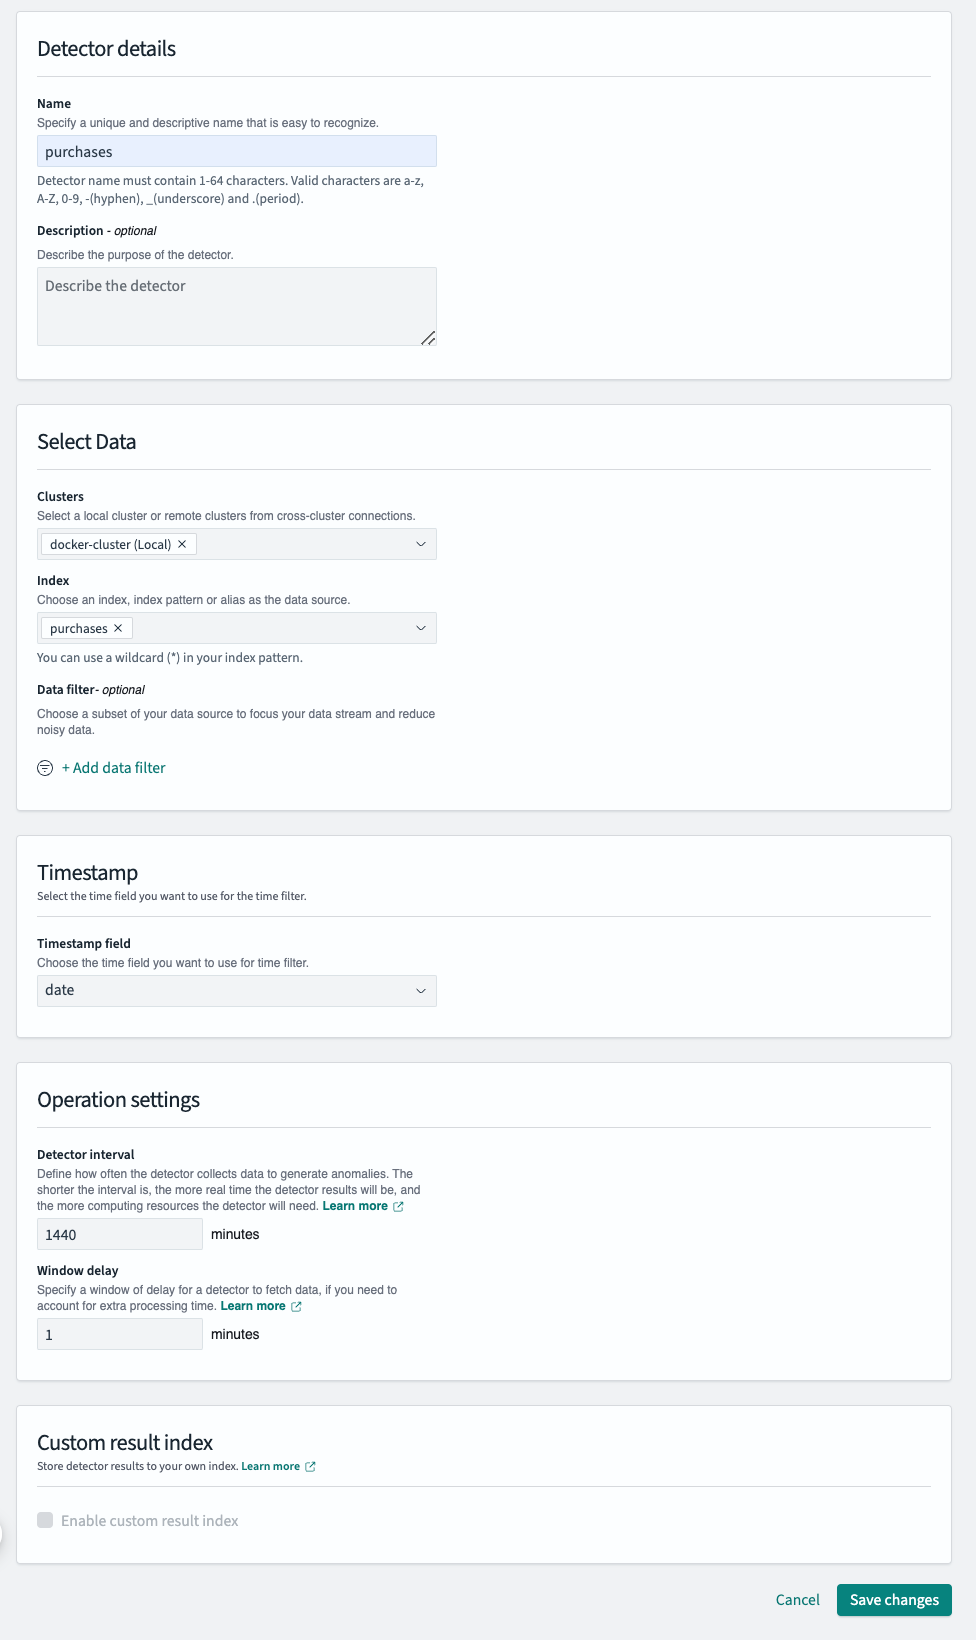
감지기 설정
2. Feature 설정
이상 탐지는 지정한 Feature의 평균값을 기준으로 수행됩니다. 본 사례에서는 상품별 구매 건수의 이상 탐지를 수행하기 위해 Category Fields를 활용했습니다.
Category Fields를 사용하지 않을 경우, 전체 데이터의 평균값을 기준으로 이상 탐지가 이루어집니다. 반면, Category Fields를 적용하면 각 그룹 내 평균값을 기준으로 이상 탐지를 수행할 수 있습니다.
※ 참고: Category Fields에 지정할 필드는 반드시 색인 타입이 keyword여야 합니다.
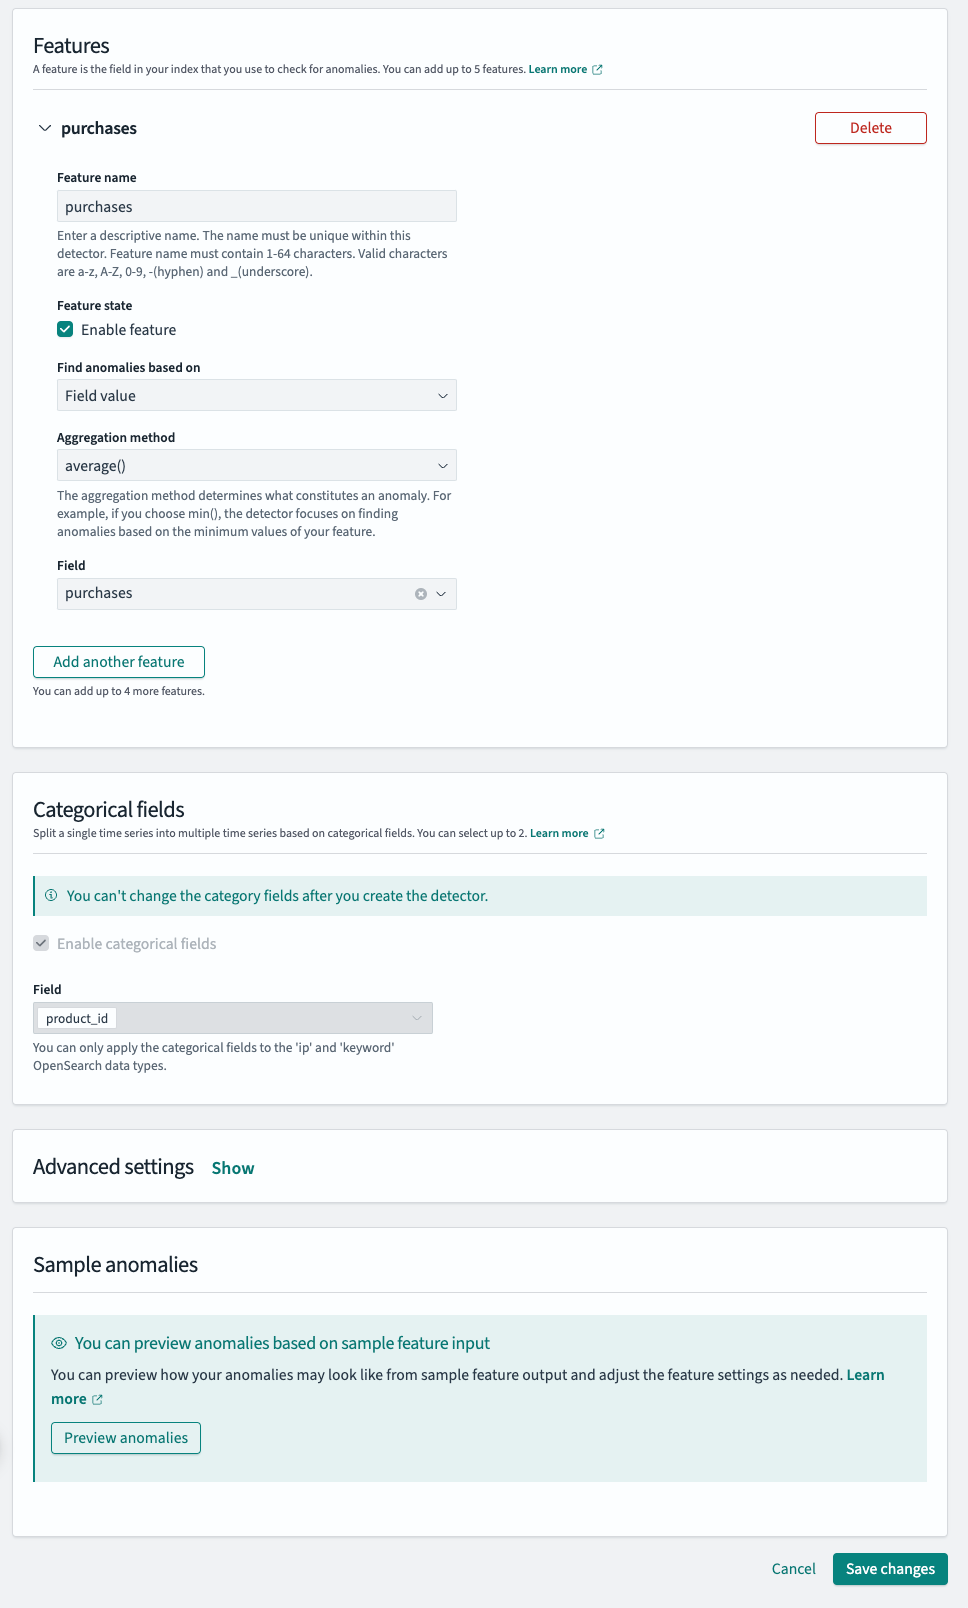
탐지할 Feature 설정
색인 완료된 과거 데이터 분석(Historical Analysis)과 실시간 탐지
- 과거 데이터 분석
- 이상 등급(Anomaly Grade): 데이터 포인트가 기존 패턴에서 얼마나 벗어났는지를 점수화. 예를 들어, Anomaly Grade 값이 0.7이면 해당 데이터 포인트가 비정상일 가능성이 높다는 것을 의미합니다. 일반적으로 0에 가까울수록 정상 데이터에 가깝고, 1에 가까울수록 패턴에서 크게 벗어난 것으로 해석됩니다.
- 신뢰 점수(Confidence Score): 이상 탐지 결과의 신뢰도를 나타냄니다. 1에 가까울수록 신뢰도 높다는것을 의미합니다.
- 분석 결과는 그래프로 제공되며, 날짜별 이상치가 시각화됩니다.
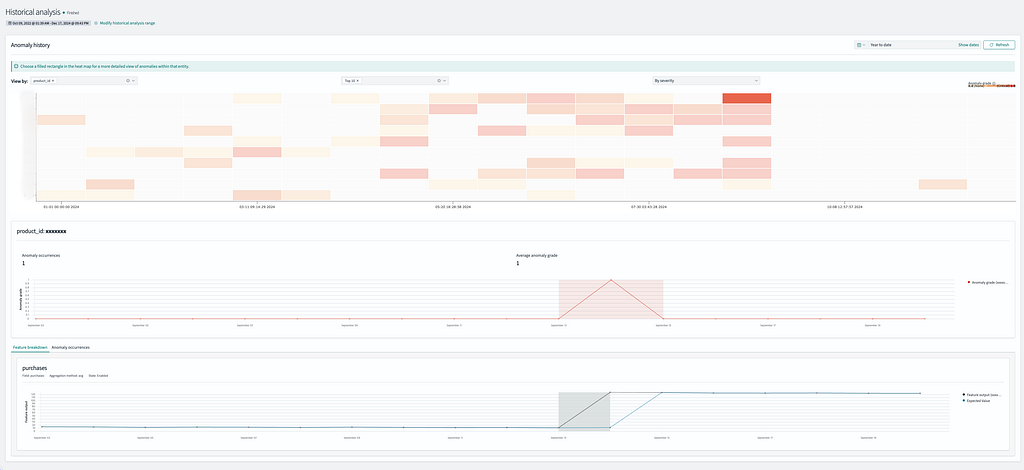
역사적 분석
2. 실시간 탐지
- 아래 그림의 상단 오른쪽에 위치한 Start Detector 버튼을 클릭하면 실시간 탐지가 시작됩니다. 클릭한 시간(예: 오전 9시)을 기준으로, 설정한 Detector interval에 따라 24시간 단위로 이상 데이터를 탐지합니다. 이 예시에서는 24시간 기준으로 설정되어, 매일 오전 9시에 이상 데이터를 탐지하게 됩니다.

실시간 데이터 감지 설정
알림 설정
이상 탐지가 발생했을 때 Slack으로 알림을 보내도록 설정합니다.
알림 채널 설정
- Notifications 메뉴로 이동합니다.
- Create Channel 버튼을 클릭해 새로운 알림 채널을 생성합니다.
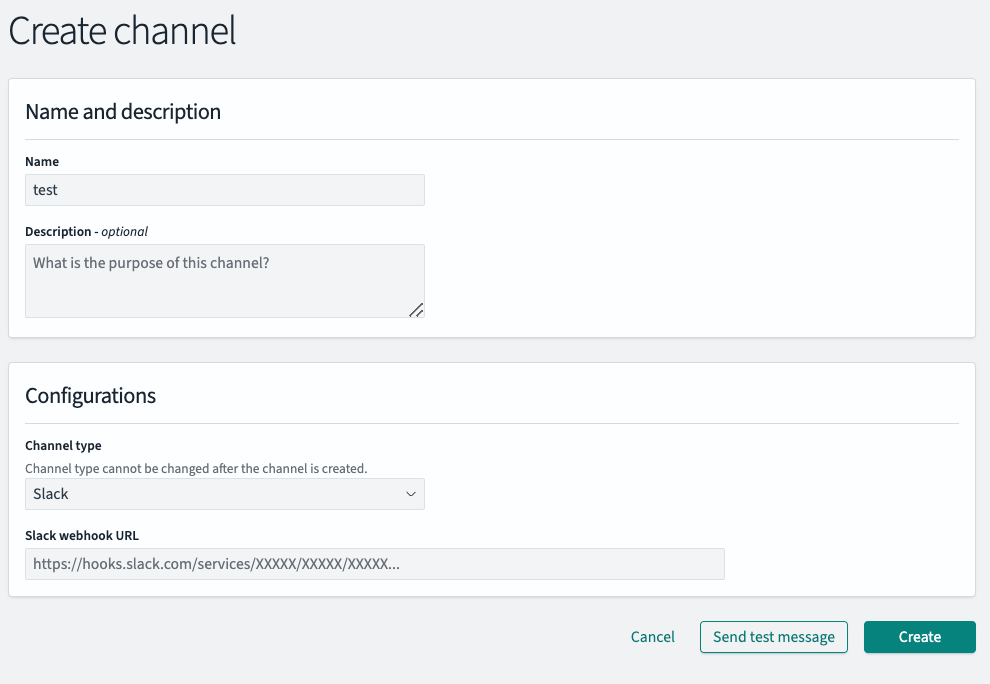
알림 채널 설정
모니터링 설정
- Alerting메뉴로 이동합니다.
- Create Monitor 버튼을 클릭해 새로운 알림 채널을 생성합니다.
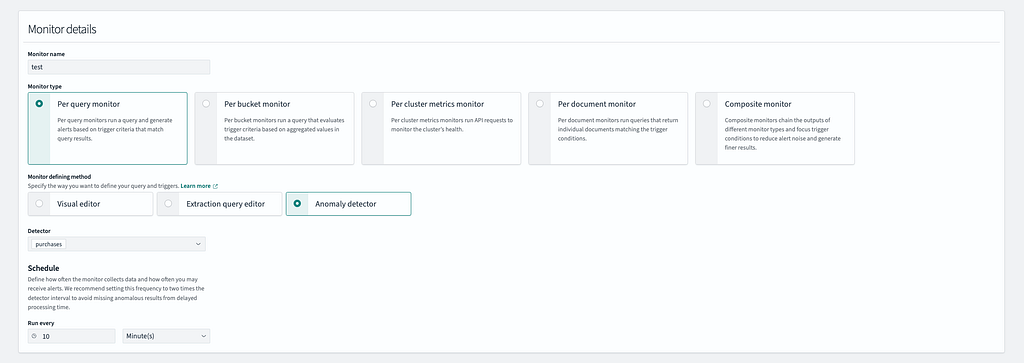
알림 모니터링 타입 설정
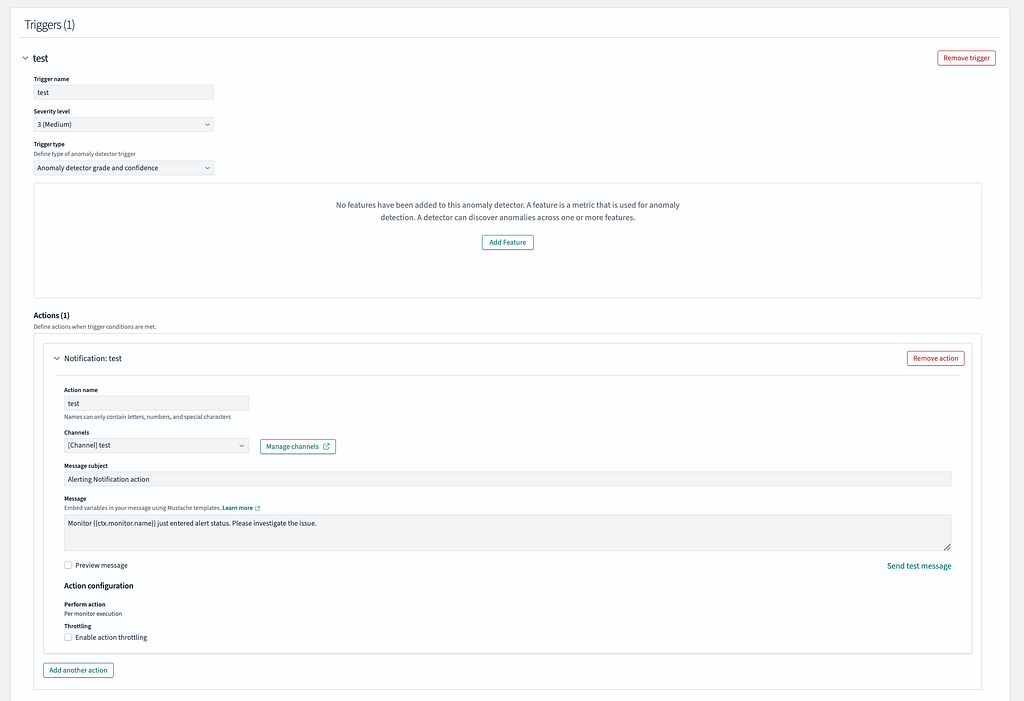
알림 조건 설정
알림 조건 설정
쿼리를 이용해 알림 조건을 직접 설정할 수 있습니다.
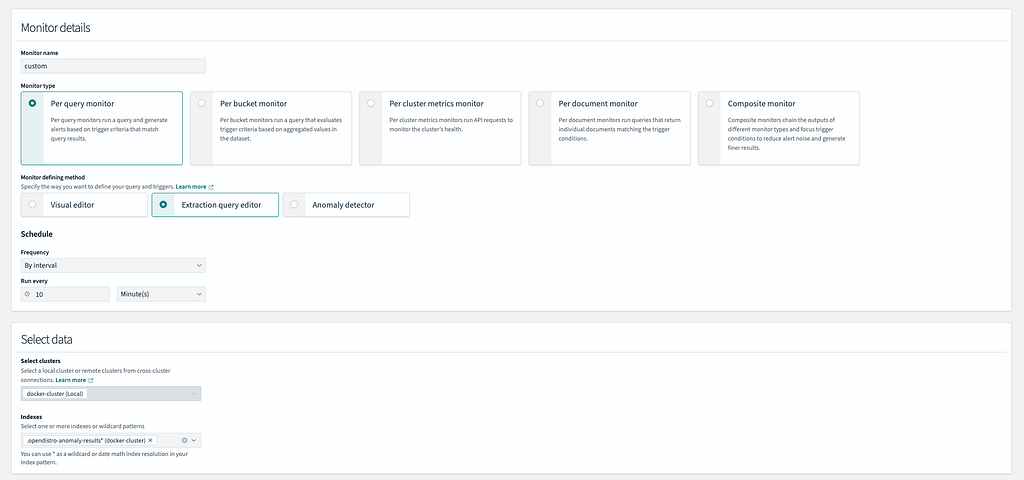
커스텀 모니터링 설정 1
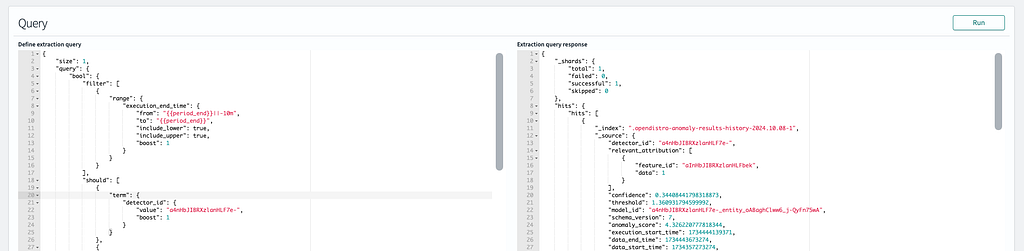
커스텀 모니터링 설정2
아래는 위 그림의 쿼리 내용입니다. 아래 detector_id 아이디는 위에서 설정한 이상 탐지 설정 아이디입니다. 해당 아이디는 이상 탐지 설정 화면 URL을 보면 알 수 있습니다. 아래 쿼리에서 should로 두 개를 묶은 것은 두 개의 이상 탐지를 설정해 놓았고, 이를 모두 모니터링하려는 목적입니다.
ex) http://localhost:5601/app/anomaly-detection-dashboards#/detectors/a4nHbJIBRXzlanHLF7e-/results
{
    "size": 1,
    "query": {
        "bool": {
            "filter": [
                {
                    "range": {
                        "execution_end_time": {
                            "from": "{{period_end}}||-10m",
                            "to": "{{period_end}}",
                            "include_lower": true,
                            "include_upper": true,
                            "boost": 1
                        }
                    }
                }
            ],
            "should": [
                {
                    "term": {
                        "detector_id": {
                            "value": "a4nHbJIBRXzlanHLF7e-",
                            "boost": 1
                        }
                    }
                },
                {
                    "term": {
                        "detector_id": {
                            "value": "Z6sLbZIBRXzlanHLvpdG",
                            "boost": 1
                        }
                    }
                }
            ],
            "adjust_pure_negative": true,
            "boost": 1
        }
    },
    "sort": [
        {
            "anomaly_grade": {
                "order": "desc"
            }
        },
        {
            "confidence": {
                "order": "desc"
            }
        }
    ],
    "aggregations": {
        "max_anomaly_grade": {
            "max": {
                "field": "anomaly_grade"
            }
        }
    }
}
커스텀 모니터링 설정3
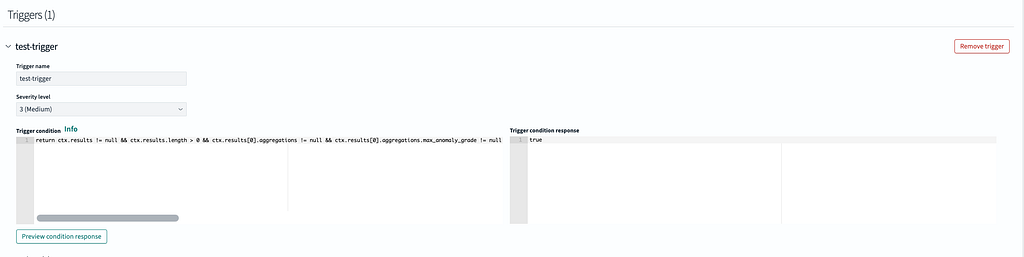
알림 오는 조건을 쿼리로 조절할 수 있는데, 아래는 위 그림의 쿼리 내용입니다. 앞서 모니터링 데이터 조건을 설정하였는데, 해당 조건의 결과를 가지고 아래 쿼리로 데이터를 추출하여 max_anomaly_grade와 confidence 수치에 조건을 겁니다. 처음에 선택하여 조건 설정하였을 때는 모니터링 데이터 중 0.7 이상일 경우에 알림이 오도록 되어있습니다. 하지만 아래 쿼리처럼 예를 들어 max_anomaly_grade(이상 등급: 최고 1)이 0.9 이고, confidence(신뢰도)가 0.9일 경우에만 알림이 오도록 할 수 있습니다.
return  ctx.results  !=  null  &&  ctx.results.length  >  0  &&
ctx.results[0].aggregations  ! =  null  &&
ctx.results[0].aggregations.max_anomaly_grade  !=  null  &&
ctx.results[0].hits.total.value  >  0  &&
ctx.results[0].hits.hits[0]._source  !=  null  &&
ctx.results[0].hits.hits[0]._source.confidence  !=  null  &&
ctx.results[0].aggregations.max_anomaly_grade.value  !=  null  &&
ctx.results[0].aggregations.max_anomaly_grade.value  >=  0.9  &&
ctx.results[0].hits.hits[0]._source.confidence  >=  0.9
결론
OpenSearch의 Anomaly Detection 기능은 무료로 제공되며 설정이 간편하다는 점에서 실용적입니다. CPU 사용률, 메모리, 트랜잭션, IoT 센서 등 시계열 데이터 모니터링에 적합하며, 이상 탐지와 알림 기능을 통해 비정상적인 변동을 신속하게 감지할 수 있습니다. e-커머스, 금융, IT 운영 등 다양한 산업에서 활용 가능성이 높아 비즈니스와 시스템 모니터링에 효과적으로 기여할 수 있습니다.